Evidence status: self-reported n=3 confirmation. The fresh speed cells below use three measured repetitions. Cn produced no valid aggregate throughput result. The page keeps those limits on the record.
The official Qwen/Qwen3.8-27B-FP8 artifact now loads and serves across two Intel Arc Pro B70s on a 32 GiB host. The speed route is TP2/PP1, MTP4, FP8 KV cache, and compile-only execution with XPU Graph disabled.
The first result to remember is 44.71 tok/s end-to-end at p512/g128. This is request output throughput, so it includes time to first token. The approximate post-first rate is about 60.5 tok/s. At p8192, end-to-end output throughput falls to 16.46 tok/s because prompt processing dominates the request; the post-first diagnostic stays near 60.6 tok/s.
This page uses the same numeric source as the companion figures and the Qwen3.8 cookbook section. The raw campaign roots are in SergioB/B70-DOCS.
Result at a glance
| Item | Recorded value |
|---|---|
| Model | Qwen/Qwen3.8-27B-FP8 |
| Artifact | 30,890,081,596 bytes · about 28.75 GiB |
| Hardware | 2 × Intel Arc Pro B70 · 32,656 MiB visible VRAM each |
| Host | 32 GiB RAM · xe driver |
| Speed topology | TP2/PP1 · two cards in one server |
| Main route | MTP4 · compile-only · XPU Graph off |
| KV cache | FP8 |
| Research cap | 230 W configured; draw was not measured in these cells |
| Declared full context | 262,144 tokens |
| Reported full-context KV capacity | 603,082 tokens · 2.30× at 262,144-token requests |
| Concurrency result | Excluded; no valid Cn aggregate rate |
The official FP8 artifact does not leave a useful single-card serving envelope. There is no FP8 TP1 number in this record.
TP2 speed route
TP2 means tensor parallelism: the model’s layers are split across both cards and each request uses both cards. PP1 means no pipeline split. This is the route used for the fresh FP8 speed cells.
The pinned image was:
vllm/vllm-openai-xpu@sha256:f01e24f6c7ff01f1e0662234255a1372297d1dbd89d003cf13c8fad3eab1ba4fCore settings:
--tensor-parallel-size 2 --pipeline-parallel-size 1
--quantization fp8 --dtype bfloat16 --kv-cache-dtype fp8
--speculative-config '{"method":"mtp","num_speculative_tokens":4}'
--max-model-len 9216 --max-num-seqs 8 --max-num-batched-tokens 4096
--gpu-memory-utilization 0.90 --no-enable-prefix-caching --language-model-only
VLLM_XPU_ENABLE_XPU_GRAPH=0
The launch also needs two local settings:
- A spawn-time patch assigns one
ZE_AFFINITY_MASKto each worker before Level Zero initializes. - Docker gets
--cap-add SYS_PTRACEso oneCCL can use its pidfd IPC path under the default seccomp profile.
These are local launch changes. They are not upstream fixes.
Fresh TP2 C1 measurements
Each cell used exact endpoint input lengths, one same-shape warmup, unique prompt entropy, prefix caching off, and three measured requests. Output throughput is successful generated tokens divided by the request interval. Approx. post-first is 1000 / mean TPOT; it is a decode diagnostic and must not be mixed with the older custom lane statistic.
| Input / output | Output throughput | Mean TTFT | Mean TPOT | Approx. post-first | Mean ITL | Mean E2EL | MTP acceptance | Result |
|---|---|---|---|---|---|---|---|---|
| p512 / g128 | 44.71 tok/s | 762.38 ms | 16.539 ms | 60.46 tok/s | 75.920 ms | 2,862.83 ms | 82.14% · 4.29 tokens | 3/3 |
| p2048 / g128 | 35.59 tok/s | 1,489.11 ms | 16.595 ms | 60.26 tok/s | 77.106 ms | 3,596.68 ms | 93.29% · 4.73 tokens | 3/3 |
| p8192 / g128 | 16.46 tok/s | 5,681.05 ms | 16.489 ms | 60.65 tok/s | 78.530 ms | 7,775.19 ms | 96.56% · 4.86 tokens | 3/3 |
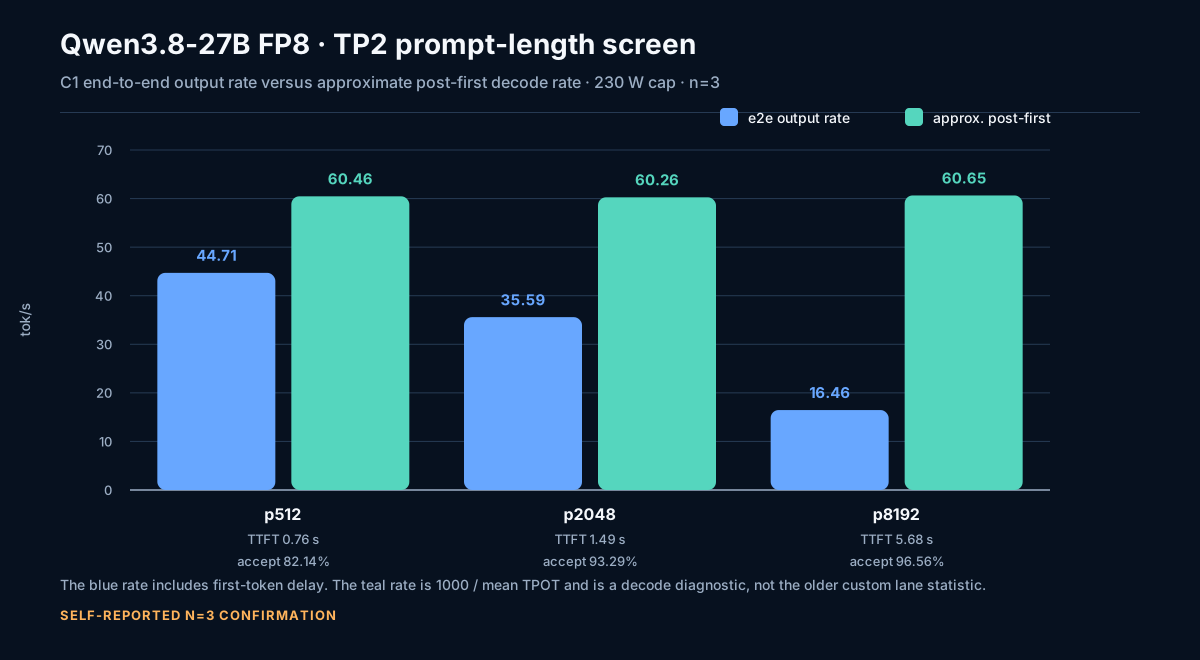
Open the prompt-length SVG. The blue bars include first-token delay. The teal bars show the approximate post-first diagnostic.
The decoder is nearly flat at about 16.5 ms per generated token in the FP8 C1 cells. The visible rate drop comes from the prompt side: mean TTFT grows from 0.76 s at p512 to 5.68 s at p8192.
Full-context check
The model declares a 262,144-token context. A full-context server reported 603,082 KV tokens and 2.30× maximum concurrency for requests at the declared maximum length. That is a capacity report, not a completed multi-user throughput test.
The valid near-maximum request was p240000/g128, n=1:
| Cell | Output throughput | Mean TTFT | Mean TPOT | Acceptance | Result |
|---|---|---|---|---|---|
| p240000 / g128 | 0.179 tok/s | 711.06 s | 25.681 ms | 80.42% · 4.22 tokens | 1/1 |
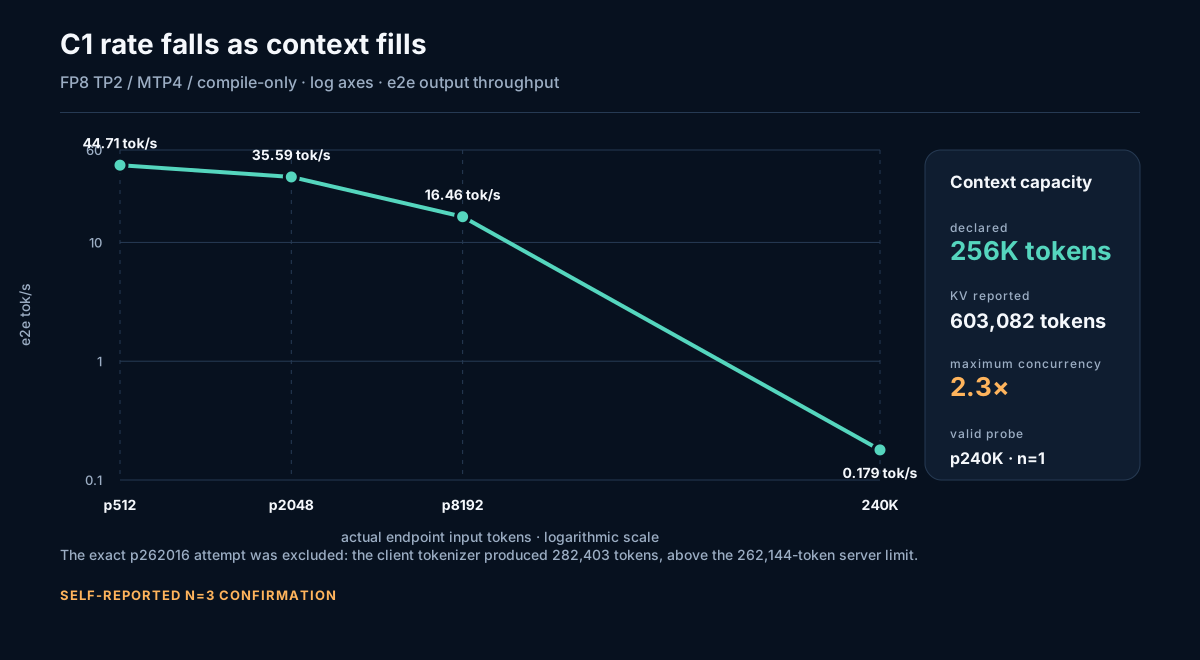
Open the context-scaling SVG. The x and y axes are logarithmic so the p240K point remains visible beside the shorter C1 cells.
The exact p262016 attempt is excluded. The client tokenizer produced 282,403 tokens, above the 262,144-token server limit. The p240K result is therefore the valid near-maximum probe in this record.
Why the speed route keeps XPU Graph off
“Compile-only” here means vLLM compilation remains enabled while XPU Graph capture is disabled with VLLM_XPU_ENABLE_XPU_GRAPH=0.
MTP1 and MTP2 full graph capture work on this TP2 setup. The fresh MTP2 endpoint cells and the historical MTP4 custom-lane cells use different statistics, so they are not a clean same-metric speed A/B. MTP4 full graph capture failed in earlier runs. cudagraph_mode=PIECEWISE made one MTP4 request work, but it was only a functional probe.
The statistics are kept separate because the fresh MTP2 values are n=3 endpoint output rates, while the MTP4 rows are historical custom post-first lane values.
| Mode | Graph setting | Recorded cell | Rate | Evidence level |
|---|---|---|---|---|
| MTP2 | Full graph | p512/g128, n=3 | 34.39 tok/s e2e · 39.41 approx. post-first | Fresh confirmation |
| MTP2 | Full graph | p8192/g128, n=3 | 11.30 tok/s e2e · 32.06 approx. post-first | Fresh confirmation |
| MTP4 | Compile-only | p512/g128, n=5 | 46.97 tok/s | Historical custom lane |
| MTP4 | PIECEWISE | p512/g128, n=1 | 44.98 tok/s | Functional one-request probe |
| MTP4 | Full graph | TP2 attempt | No rate | Deadlock; excluded |
| MTP1 | Full graph | p512/g128, n=5 | 28.36 tok/s | Historical custom lane |
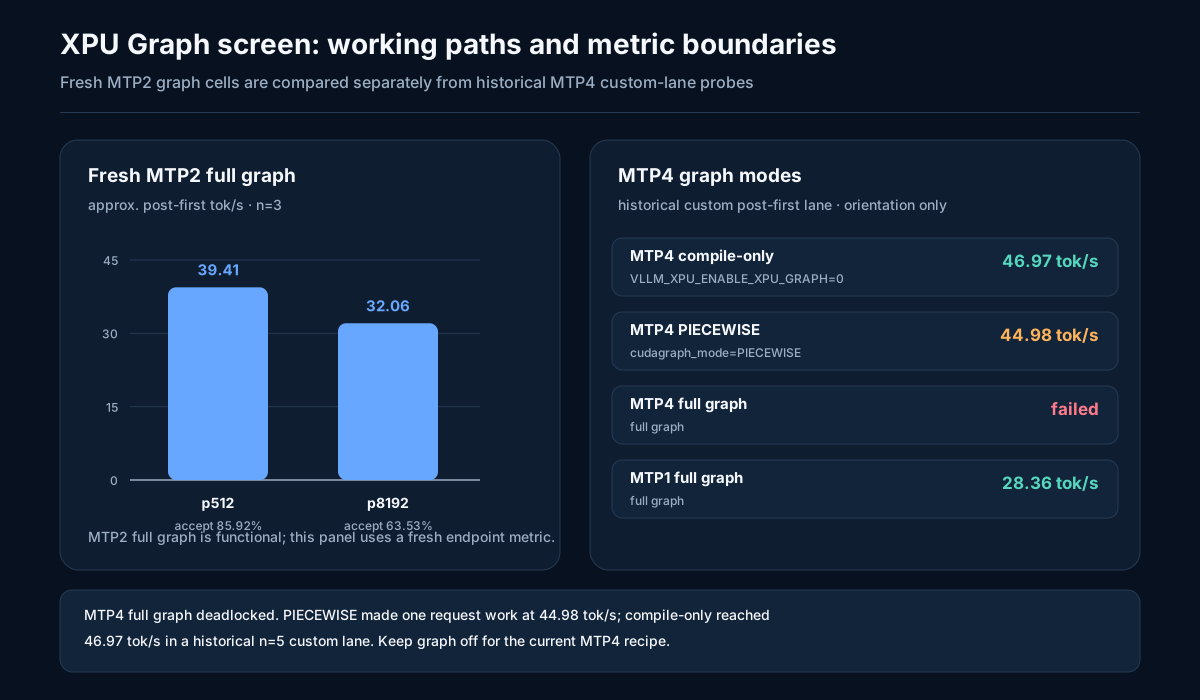
Open the graph-screen SVG. The current recommendation keeps graph capture off for MTP4 because full graph failed and PIECEWISE was only a one-request functional probe. It does not claim that graphs never help on XPU.
The practical decision is straightforward: MTP4 compile-only is the current speed route; MTP2 full graph is a working fallback; MTP4 PIECEWISE is a functional test mode; MTP4 full graph is not usable on this build.
TP2 and PP2 are separate topologies
Both routes use two B70s, but they split work differently and should not share one result table.
TP2: speed route
TP2 shards the model across both cards during each forward pass. It is the only official FP8 route in this record with fresh C1 speed data. It still does not give a 2× C1 result: each token pays cross-card synchronization and the request has one shared latency path.
PP2: load and validation route
PP2 means pipeline parallelism: --tensor-parallel-size 1 --pipeline-parallel-size 2. It proved that the official FP8 artifact can load and produce output across both cards, but it is much slower in the historical validation lane. These rows use n=5 custom-lane measurements and are not comparable to the fresh TP2 table.
| PP2 mode | TP / PP | C1 decode | Cold input | Status |
|---|---|---|---|---|
| Eager | 1 / 2 | 8.05 tok/s | 1,077 tok/s | Validation only |
| Compile | 1 / 2 | 10.9 tok/s | 639 tok/s | Validation only; graph capture had no speed effect |
PP2 is useful when the question is “can the artifact be staged across both cards?” It is not the selected FP8 speed path. The PP2 results used the same per-worker affinity and SYS_PTRACE launch settings, with a serial materialization overlay used only for the validation load path.
INT4 comparison on the same model family
The current INT4 route is a separate artifact and a separate kernel path. It is included to explain why the smaller representation can be faster even when both tests use two cards.
Current TP2 comparison
These are matched n=3 C1 endpoint cells at a configured 230 W cap. FP8 uses the official artifact, MTP4, compile-only, and FP8 KV. INT4 uses the current no-g_idx artifact, MTP4, full graph, and FP8 KV.
| Input | FP8 TP2 e2e output | INT4 TP2 e2e output | Current INT4 result |
|---|---|---|---|
| p512 / g128 | 44.71 tok/s | 84.00 tok/s | 3/3 |
| p2048 / g128 | 35.59 tok/s | 38.35 tok/s | 3/3 |
| p8192 / g128 | 16.46 tok/s | 24.52 tok/s | 3/3 |
The current TP2 data shows INT4 ahead in all three end-to-end cells. The likely contributors are lower weight traffic and a more mature INT4 kernel path on this build. That explanation is an inference from the measurements; no profiler breakdown was captured here.
Current single-card INT4 control
The current INT4 control used one card at a configured 150 W cap. It is directionally useful, not an apples-to-apples scaling measurement against the 230 W TP2 rows.
| Input | INT4 TP1 e2e output | Approx. post-first | Result |
|---|---|---|---|
| p512 / g128 | 49.08 tok/s | 60.54 tok/s | 3/3 |
| p8192 / g128 | 12.51 tok/s | 65.33 tok/s | 3/3 |
The older 230 W INT4 figures, 83.7 tok/s at p512 and 77.1 tok/s at p8192, used an older g_idx artifact and the historical custom post-first statistic. They remain orientation data only and are not blended into the current table.
Host RAM was a separate dual-GPU blocker
The model fit the combined VRAM budget, but the host had only 32 GiB of RAM. A Level Zero process that could see both GPUs consumed host memory at nearly the same scale as its device allocation.
| Process view | Device allocation in probe | Host overhead in probe | Reading |
|---|---|---|---|
| One process sees both GPUs | 11.0 GiB | 10.97 GiB | Problem case |
| One process sees one GPU | 5.6 GiB | 0.77 GiB | Single-device control |
| Two workers, one GPU mask each | 10.5 GiB | 0.82 GiB | Working dual-worker shape |
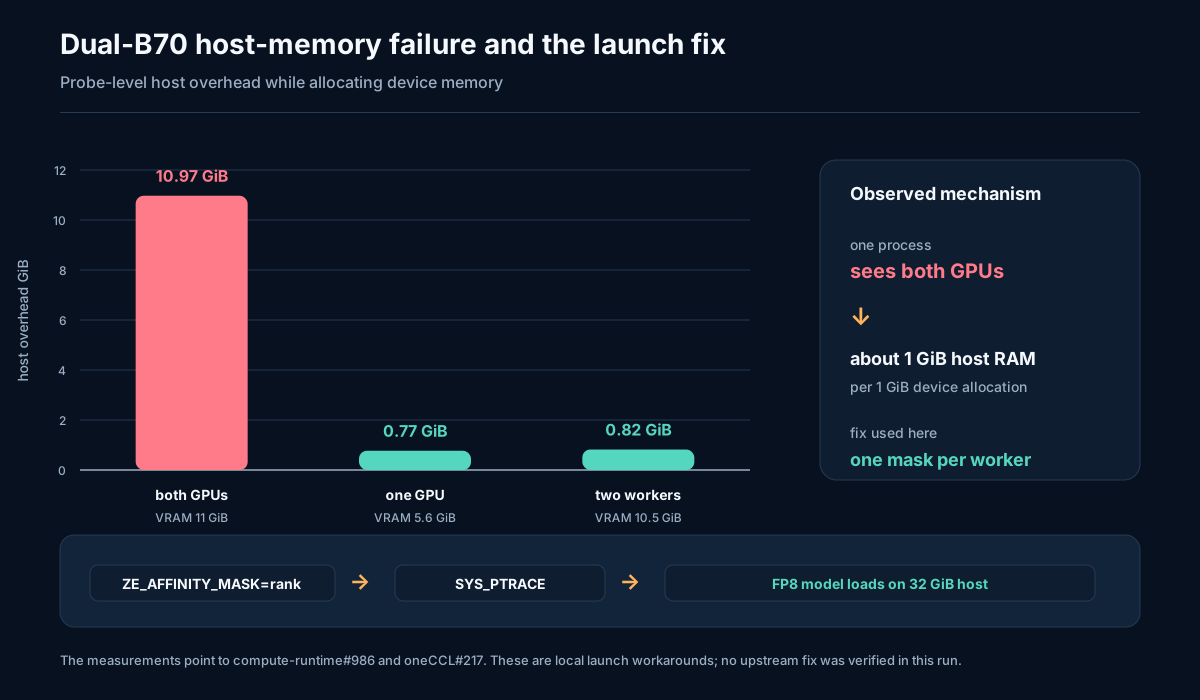
Open the host-memory SVG. These are probe-level resident-memory deltas, not total system-memory readings.
The findings match two open upstream reports:
- intel/compute-runtime#986: host-memory growth when one process sees multiple GPUs.
- uxlfoundation/oneCCL#217: pidfd IPC and Docker seccomp interaction.
The working local launch shape is one device mask per spawned worker plus Docker SYS_PTRACE. CCL_ZE_IPC_EXCHANGE=none was ignored in the tested environment. No upstream fix was verified in this run.
INT4 virtual-address failure and rejected patch
Several INT4 attempts on this boot reached a separate failure in mamba_utils: the GDN state pool landed at device addresses at or above 2^63, while this vLLM build stored pointers in signed int64 tensors.
The two’s-complement wrap patch stopped the Python overflow exception, but the kernels then read wrapped addresses and produced garbage tokens. That patch is rejected. The real fix is to make the allocation land below 2^63, not to reinterpret an invalid pointer.
The current no-g_idx INT4 TP2 n=3 rows above completed the throughput cells. The rejected wrap remains recorded because it explains why a seemingly harmless overflow fix cannot be used as a serving recipe.
Concurrency result: capacity was measured, throughput was not
At max_model_len=9216, the speed server reported 132,096 KV tokens and 14.33× maximum concurrency at the full request length. A C14 wave was sized from that report.
| Attempt | Result | Reason |
|---|---|---|
| C14 MTP4 | Excluded | causal_conv1d rejected speculative-decode and non-spec tokens in the same invocation |
| C19 MTP4 | Excluded | 1 success and 56 failures with the same mixed prefill/decode failure |
| C14 no-spec compile | Excluded before health | Host MemAvailable reached 1,029 MiB; the watchdog floor was 3,072 MiB |
| C14 no-spec eager | Excluded before health | Host MemAvailable reached 1,008 MiB; the watchdog floor was 3,072 MiB |
No Cn aggregate throughput number is published for this build. C1 output throughput and Cn aggregate throughput are different measurements. The next valid concurrency run needs both a fixed GDN mixed prefill/decode path and a host-memory load that stays above the watchdog floor.
Patch and configuration ledger
| Item | State | Scope | Reason |
|---|---|---|---|
| Per-worker Level Zero affinity patch | Required local workaround | TP2 and PP2 | Sets one mask per worker before device initialization |
Docker SYS_PTRACE | Required launch setting | TP2 and PP2 | Keeps oneCCL pidfd IPC on its working path under seccomp |
cudagraph_mode=PIECEWISE | Functional graph workaround | MTP4 graph test | Avoids the first-generation full-graph failure; slower than compile-only |
VLLM_XPU_ENABLE_XPU_GRAPH=0 | Current speed setting | TP2 MTP4 | Fastest functional MTP4 route measured here |
| Two’s-complement pointer wrap | Rejected | INT4 | Prevented the exception but produced invalid output |
The local worker patch and launch wrapper are kept in the B70 research repository’s scripts/tmp/ area until the exact source generation is promoted. The cookbook records their state as local-only workarounds.
Reproduction and evidence
The numeric source for this page is src/data/qwen38-b70-fp8.json. It was compiled from the per-cell JSON files and manifests in the following B70-DOCS evidence roots:
| Evidence | Purpose |
|---|---|
results/qw38-fp8-tp2-mtp4-230w-compile-confirm-20260828T130000Z/ | Fresh FP8 TP2 C1 n=3 |
results/qw38-fp8-tp2-mtp4-230w-fullctx-20260828T130957Z/ | Full-context server and valid p240K probe |
results/qw38-fp8-tp2-mtp2-graph-confirm-20260828T114155Z/ | Fresh MTP2 full-graph confirmation |
results/qw38-int4-tp2-mtp4-230w-graph-confirm-20260828T120423Z/ | Current INT4 TP2 comparator |
results/qw38-int4-sc-mtp4-champ-20260828T112032Z/ | Current INT4 single-card control |
research/qw38-fp8-singlecard-unblock-and-pp2-rootcause-20260827.md | RAM and affinity root cause |
Protocol choices used for the fresh cells:
- one same-shape warmup was discarded;
- actual endpoint input tokens were retained;
- prompt entropy was placed at the start of each cold request;
- prefix caching was disabled;
- output throughput used the full request interval;
- post-first rate stayed in a separate diagnostic column;
- failed and excluded attempts stayed out of throughput tables.
The figures are generated from the same JSON source:
These results are published as self-reported n=3 confirmations. The tables keep n=1, historical, and excluded evidence labels visible; they do not claim Cn throughput or performance beyond the listed cells.